

Repair shop reporting software
Figures you can open, not figures you have to believe. SlickCell is repair shop reporting software that computes revenue, profit, VAT, stock and staff costs on the server from your full dataset, and every total opens onto the records underneath it.
Why nobody trusts the reports
Not because the arithmetic is wrong. Because nothing tells you what went into it.
The dashboard, the invoice list and the tax return give three different totals for the same month.
Profit looks healthy because the cost of the parts was never counted against it.
Tax is worked out by dividing a total, so a mixed sale quietly reports the wrong figure.
A number looks wrong and there is no way to see what it is made of.
The report only covers what happened to be loaded on screen.
Month-end is a spreadsheet someone rebuilds by hand, every month.
From the event to the total
The chain below is why the number can be opened. Each link is a record, not a calculation someone ran once.
- 01The eventA sale, a repair, a part used, a payment taken.
- 02The lineIts economics are persisted on the line, not recomputed later.
- 03The movementStock used becomes a movement with a real cost.
- 04The ledgerMoney in and out lands on the account it belongs to.
- 05The totalThe server aggregates the whole dataset for your date range.
- 06The drill-downOpen the total and see the records that produced it.
Because cost of goods comes from actual stock movements and tax from the stored breakdown, profit is not an estimate laid over revenue. It is what is left after the things that actually happened.
A total, and what it is made of
The screen an owner checks on a Monday.

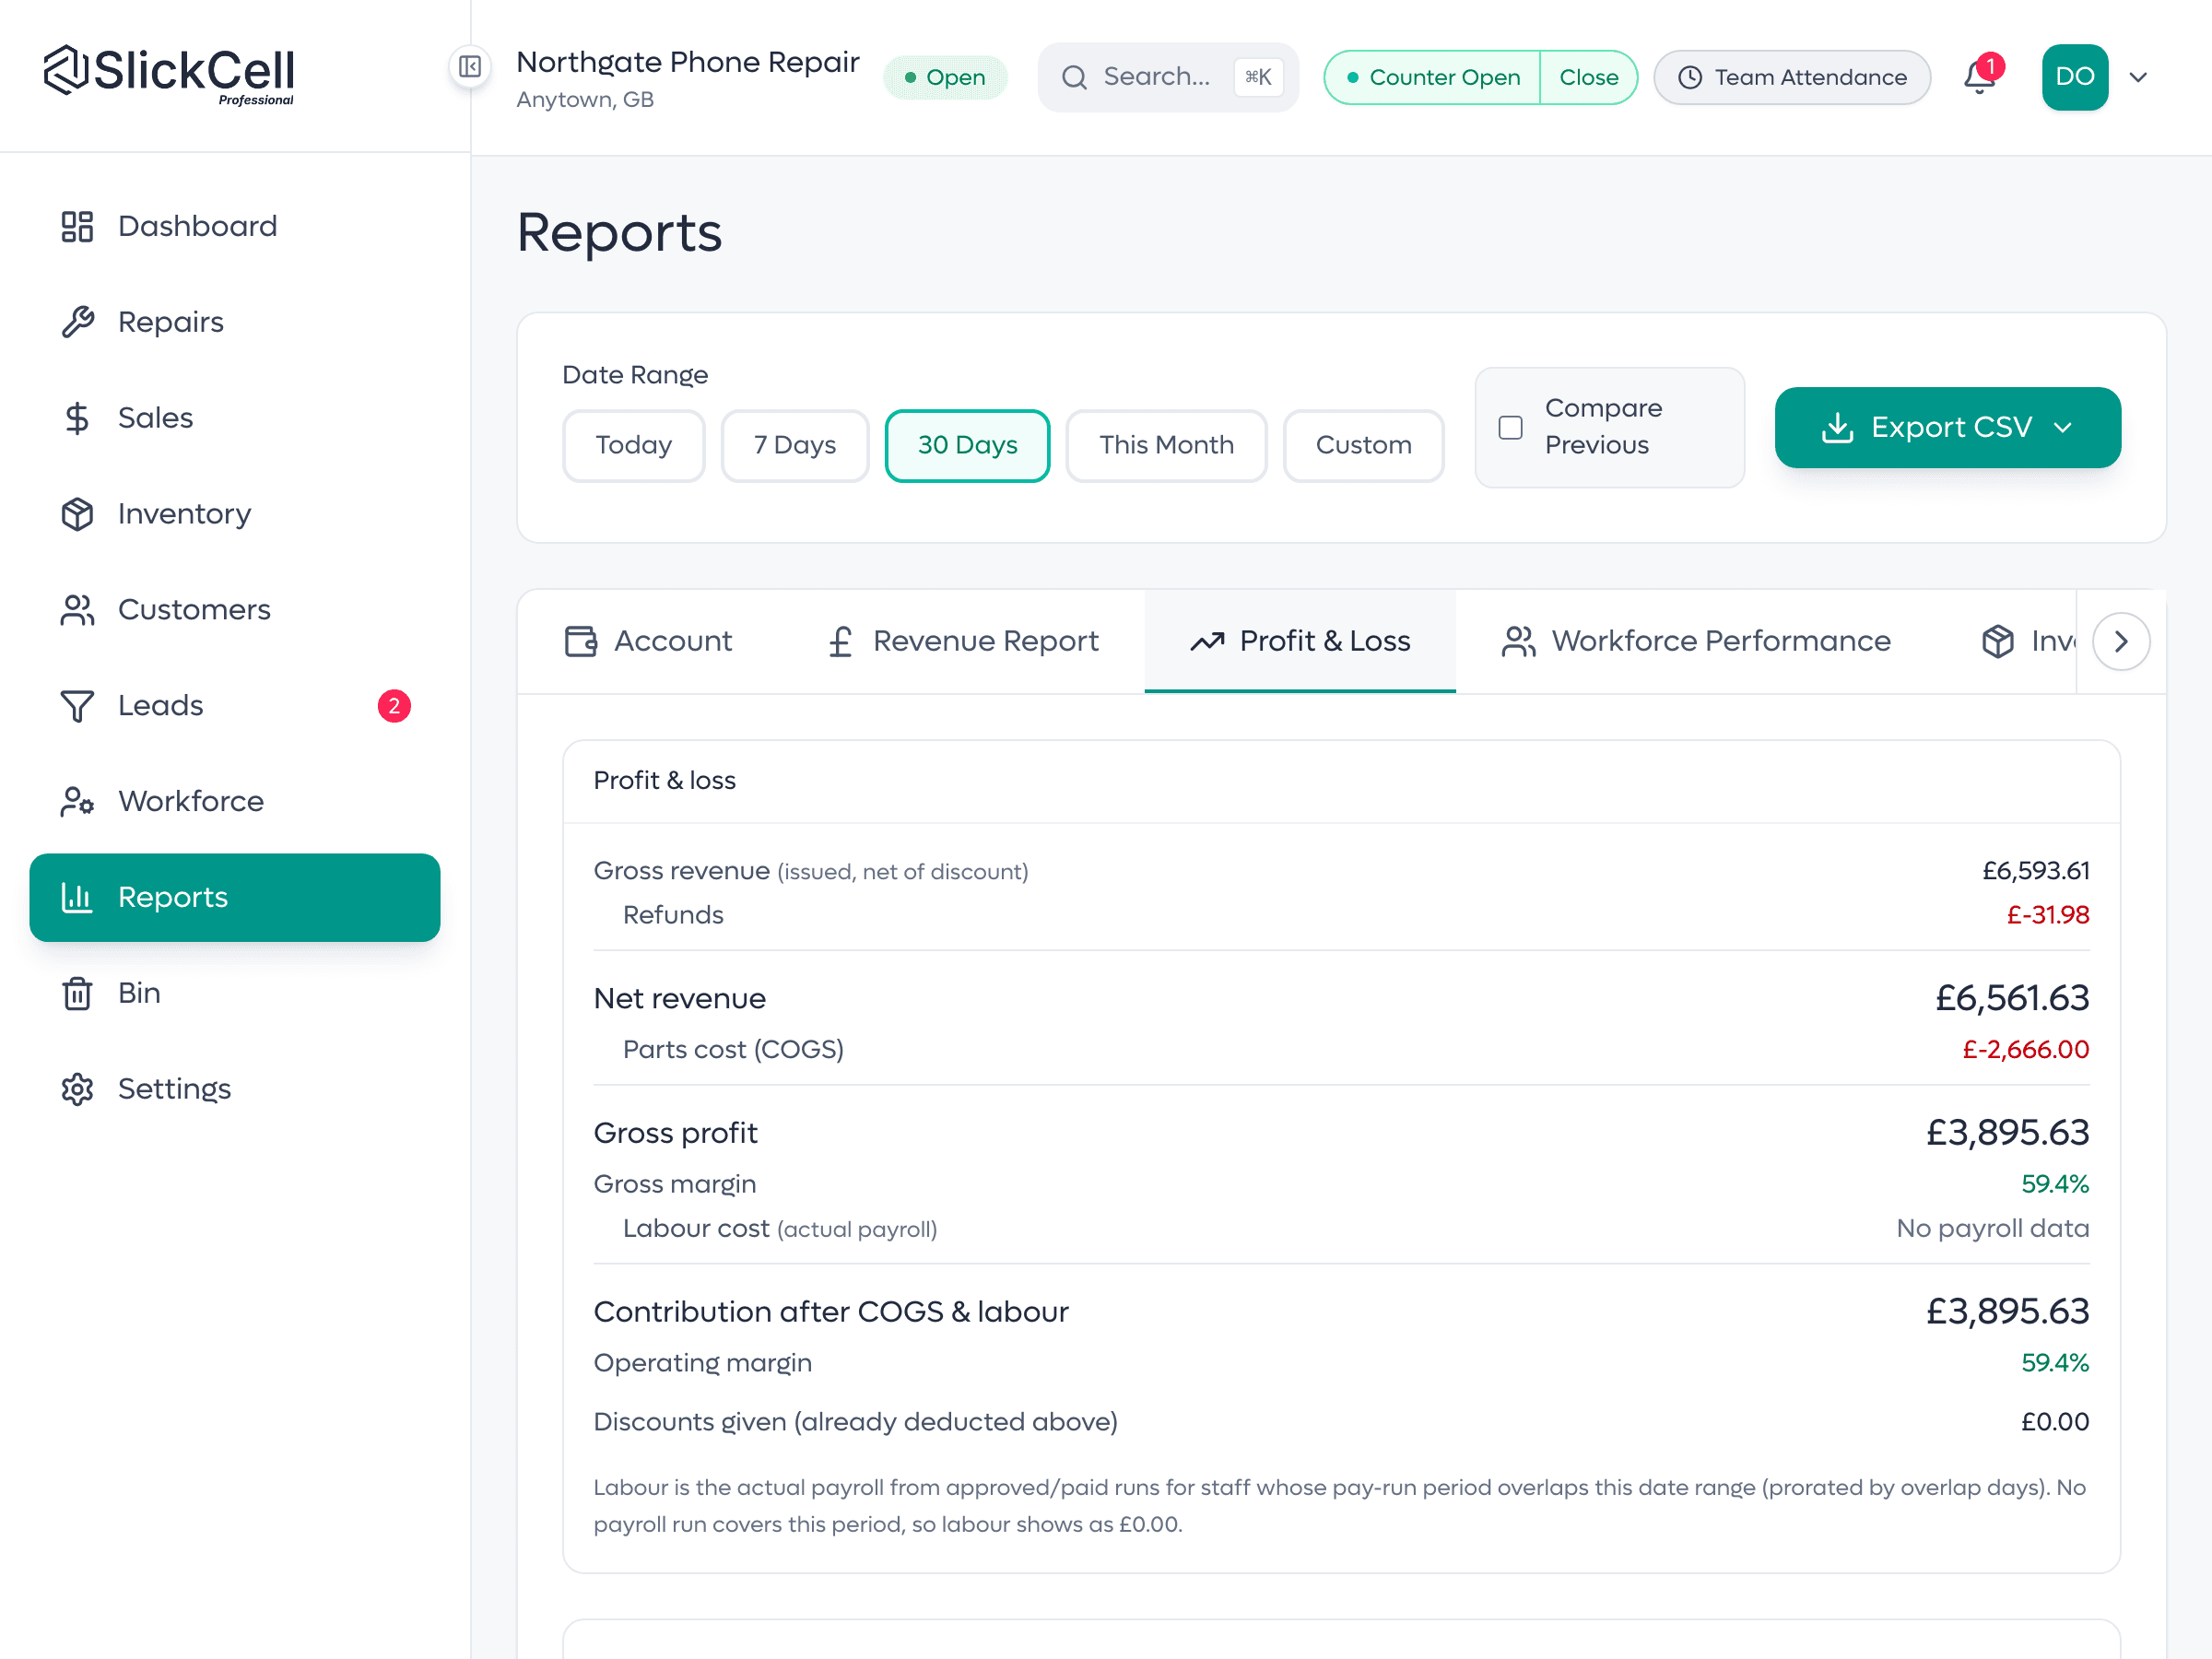
Every headline opens onto its own records
A revenue figure is not a number on a card. Open it and you get the invoices behind it, each with its own discount, tax and payment history. If a figure looks wrong, you can find out why in the report rather than in a spreadsheet.
Totals are computed on the server, over the whole date range, not over what is on screen.

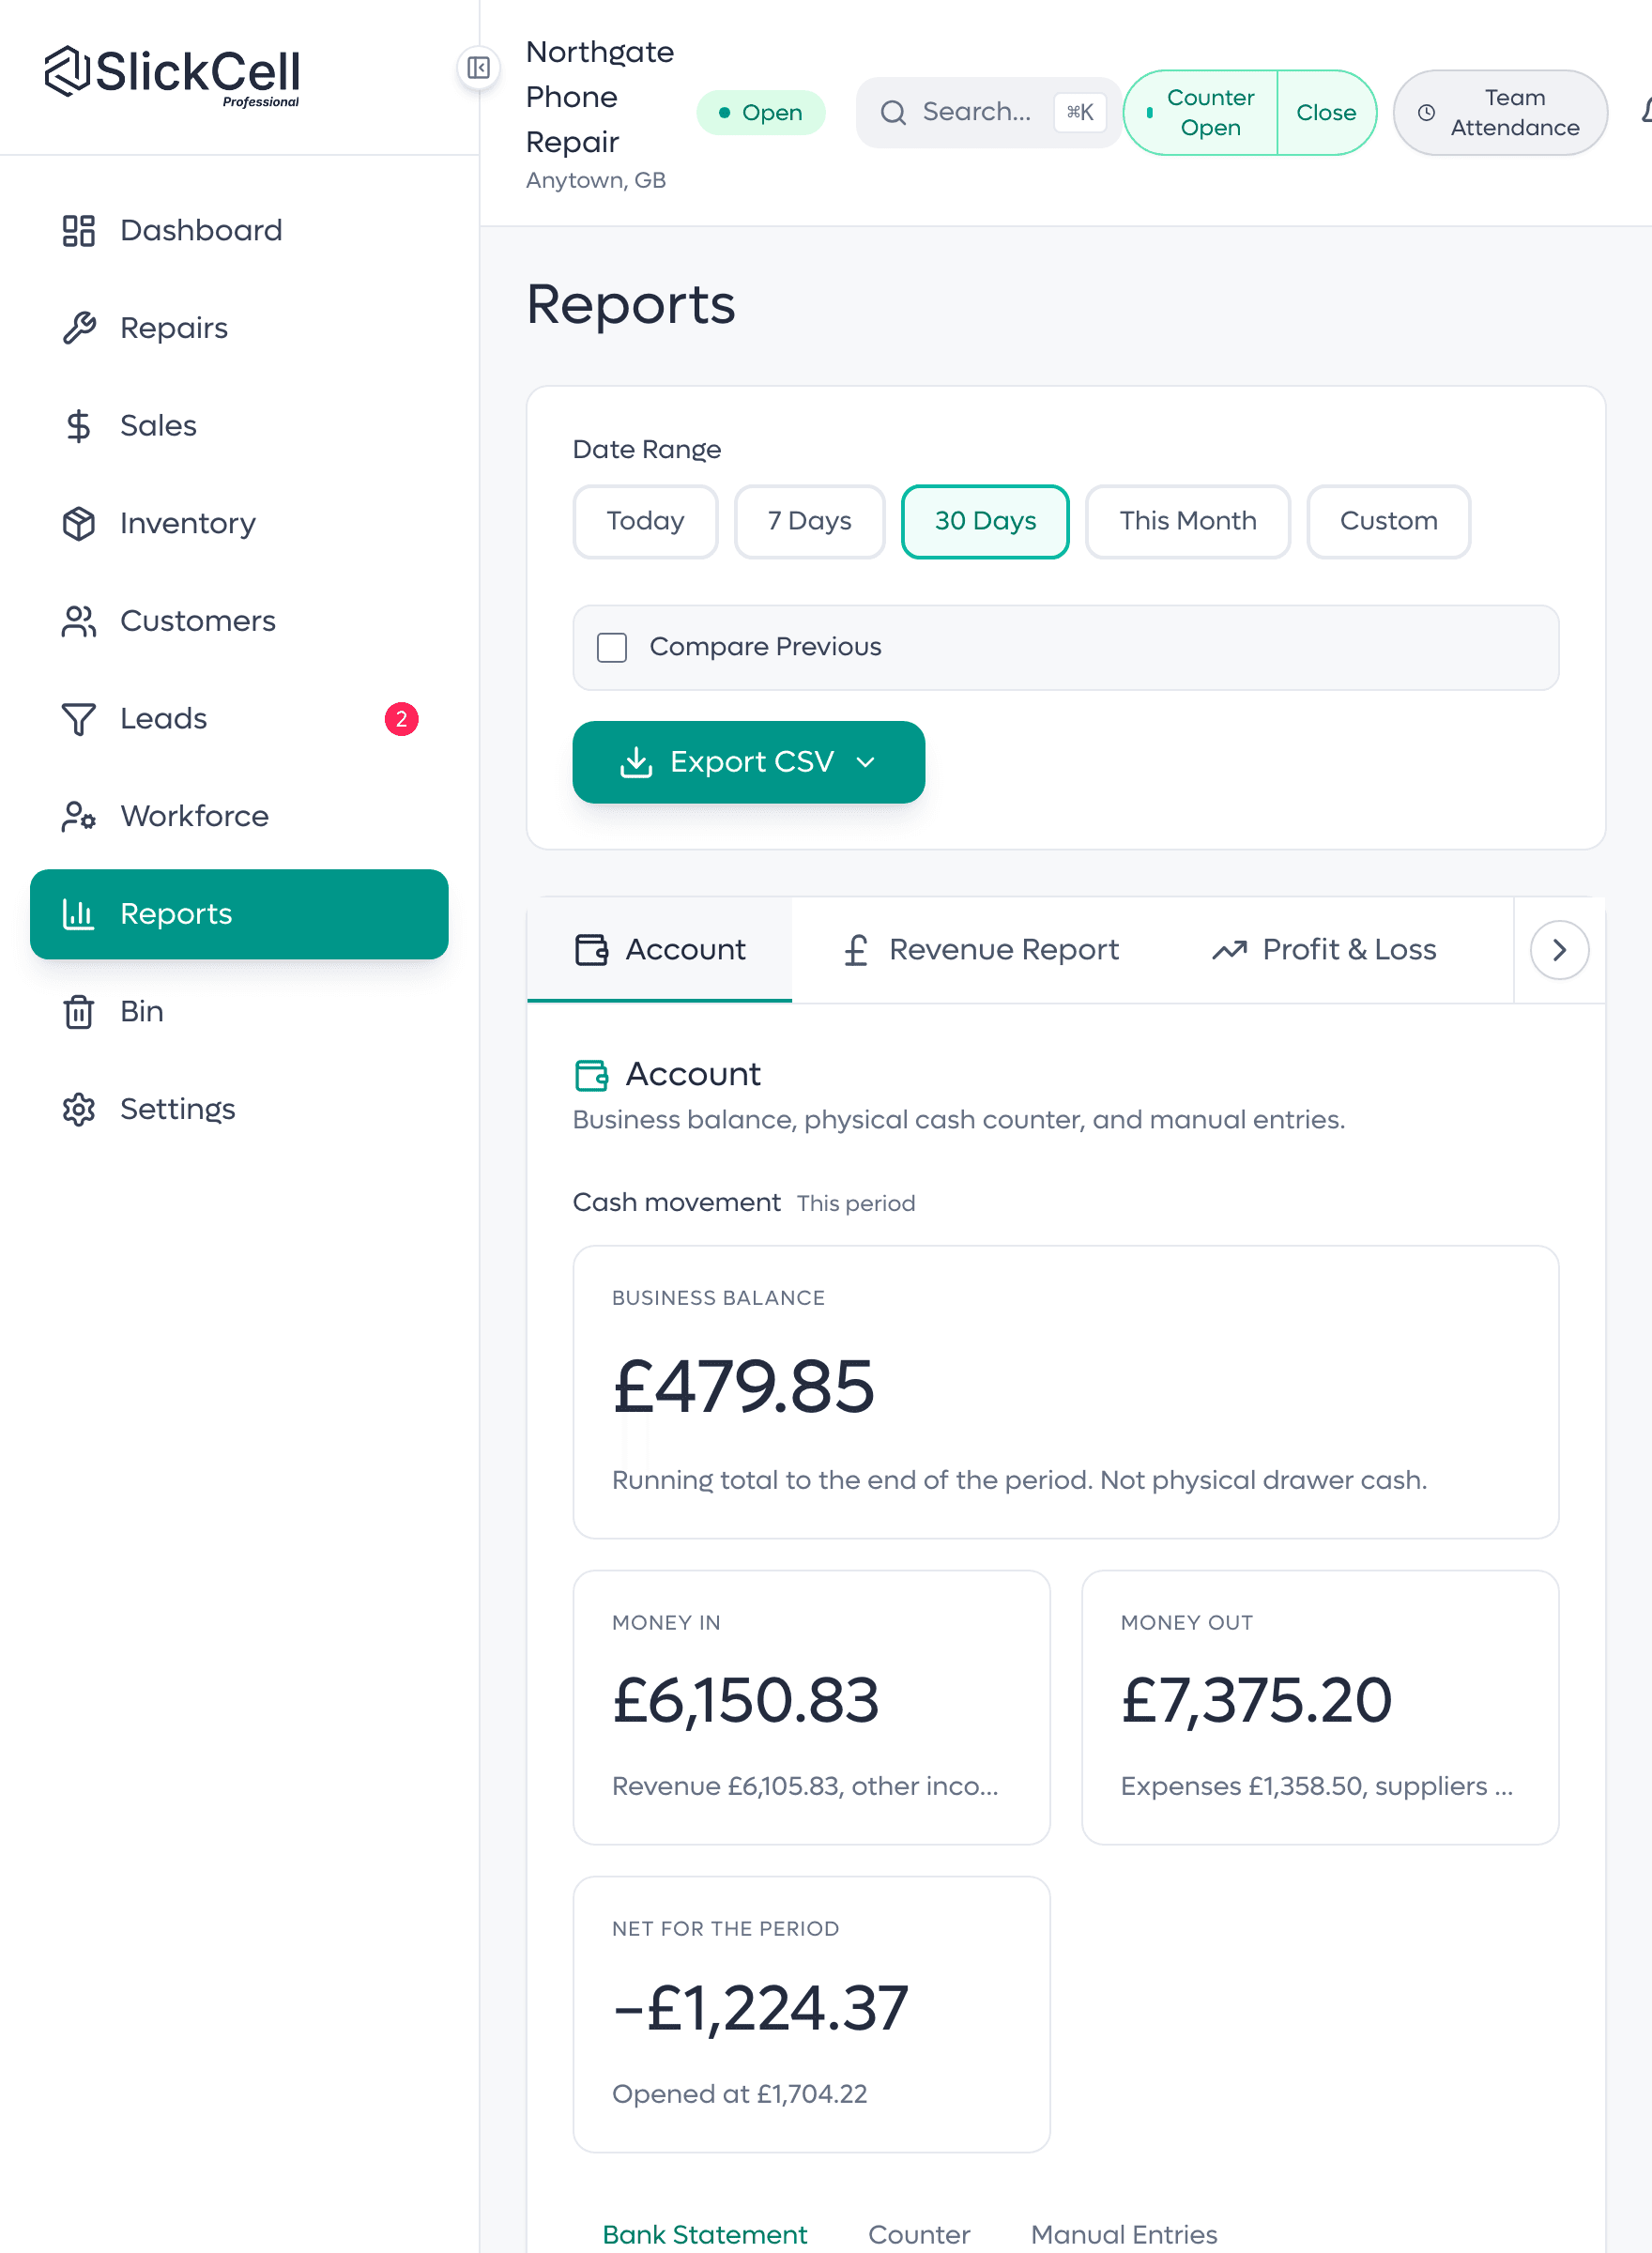
What actually came in and went out
Takings, manual income, expenses, supplier payments, refunds and trade-in payouts, day by day, with an opening and closing balance. It is the view that answers 'where did the cash go' without anyone reconstructing it.
Cash movements attach to the day they happened, from the records that caused them.
Month-end stops being a rebuild
- One set of numbers
- The report, the invoice and the dashboard read the same ledger, so they cannot disagree about the same month.
- Profit after real costs
- Cost of goods comes from the stock that was actually consumed, not from a margin assumption.
- Tax from the breakdown
- Tax is read from what was stored on each line, never back-computed by dividing a total: which is where mixed-rate sales usually go wrong.
- Per branch or across the group
- Filter to one shop or read the whole group, from the same reports.
Every SlickCell feature is included on every plan: plans differ by team size, locations, discounts and support.
Where reporting usually goes wrong
These are the specific ways a shop's numbers stop adding up.
- A sale mixes tax rates
- Each line carries its own tax, and the report reads the stored breakdown. Nothing is inferred by dividing the total by a single rate.
- A used device sold on the margin scheme
- Margin tax is reported separately from standard tax rather than being blended into one figure that suits neither.
- A refund lands in a later month
- It reduces the period it actually happened in. Revenue for a closed month is not silently rewritten.
- A discount is given on the whole basket
- It is apportioned across the lines, so both revenue and tax reflect it.
- There are more rows than the page can hold
- Totals are computed on the server across the whole range, so a busy month is not quietly truncated to what loaded.
- A number still looks wrong
- Open it. The drill-down shows the records behind the total, which is usually enough to find the entry that caused it.
This is general reporting, not tax advice. Check the rules that apply where you trade, or speak to your accountant.
Repair shop reports: profit and loss, VAT, stock and staff
Revenue and profit
Takings and what is left after the cost of the goods that produced them.
VAT and refunds
Read from the breakdown stored on each line, with margin-scheme VAT kept separate from standard-rated VAT.
The money account
Daily money in and out, with opening and closing balances.
Inventory and stock counts
What you hold, what it is worth, and what counts and trade-ins did to it.
Workforce
Output per technician, and a real labour cost from the hours on each payroll run.
Drill-down on everything
Open any headline figure and see the records that produced it.
Export to CSV
Profit and loss, VAT, payments, the ledger, stock and payroll export from the report you are reading.
AI report summaries
An AI summary reads your reports back in plain English, next to the figures it is drawn from.
Questions about repair shop reporting software
No, and that is deliberate. Each report is a server-side query over your full dataset for the date range you chose. Client-side aggregation can only ever total the rows that happen to be loaded, which is exactly how a busy month silently under-reports.
From the VAT breakdown stored on each line when the sale happened: never by dividing a total by a rate afterwards. That distinction matters the moment one sale contains items at different rates, or a used device sold under the VAT margin scheme.
Yes. Cost of goods is computed from the stock movements that actually happened, so a repair's profit is net of the part that was fitted, at the cost you actually paid for it.
Yes. Every report can be filtered to a single branch or read across the whole group, from the same screen.
Yes. The accountant role sees the financial reporting it needs and is kept out of the operational actions it does not: refunds, for instance, are not theirs to issue.
No. It gives you numbers that reconcile and records that can be inspected, which is what makes your accountant's job cheaper. What the rules are where you trade is still their question to answer.
Export them. Profit and loss, VAT including the margin scheme, payments, the account ledger, stock and payroll export to CSV from the report you are reading.
Yes. Tax is a rule you configure, and margin is one of the rule types, scoped to used stock. Each device carries its own purchase cost, so the margin on every sale is worked out from that unit, and margin-taxed sales are reported separately from standard-rated ones.
Pick a month and we will open it
We will take one of your busier months, show the totals, and drill into whichever figure you trust least.